Measurement
Three questions on retail media attribution for UK grocery networks
Attribution software for UK grocery networks must handle retailer walled gardens, ONS benchmarks and ICO data sharing rules before results travel.
What to take away
- Attribution software in UK grocery retail media has to work inside retailer walled gardens, where campaign data leaves in aggregated or modelled form.
- Named networks such as Tesco Media and Insight Platform, Nectar360, Boots Media Group, Asda Media and Morrisons Media report at different grains, so cross-network comparison needs a common definition layer.
- Retail media reporting supports reach, sales uplift and some new-to-brand measures, but it does not support person-level cross-retailer paths or causal incrementality without extra design.
- Attribution methods change when the unit of analysis moves from a click or session to a household or store catchment, and when ONS retail sales statistics are used as the external frame.
- Data sharing duties under UK GDPR and PECR apply when a grocery network passes campaign data back, and the ICO's data sharing guidance is the working reference.
- The three questions are answered below, after the reporting-grain table.
How named UK grocery retail media networks report campaign data
UK grocery retail media is not one reporting standard. Each network built its own measurement stack, and the differences matter more than the logos.
How UK grocery retail media networks report
Tesco
- Loyalty data
- Clubcard
- Reporting grain
- Campaign level
- Data passed back
- Aggregated counts
Nectar360
- Loyalty data
- Nectar card
- Reporting grain
- Audience segment
- Data passed back
- Modelled uplift
Boots
- Loyalty data
- Advantage Card
- Reporting grain
- Campaign level
- Data passed back
- Matched sales
Asda
- Loyalty data
- Asda Rewards
- Reporting grain
- Store catchment
- Data passed back
- Aggregated counts
Tesco Media and Insight Platform sells across Tesco's owned channels and Clubcard data, with reporting that leans on Clubcard-linked sales and campaign reach. Nectar360, the retail media arm tied to Sainsbury's and Nectar, reports through its loyalty panel and can connect campaigns to Nectar card activity. Boots Media Group reports on Advantage Card behaviour in health and beauty categories.
Asda Media and Morrisons Media report through their own loyalty and till data, with Asda's programme tied to Asda Rewards and Morrisons' to More card activity.
What they share is a walled garden shape. The retailer sees the transaction, the advertiser sees a campaign report. The report usually arrives as aggregated counts, modelled uplift or matched sales, not as a row-level event log the advertiser can join to its own CRM.
That shape is not an accident. It follows from the data sharing rules the network operates under and from the commercial value of the panel. When you ask what a network can pass back, the honest answer often stops at a campaign-level summary.
Reporting grains differ in three practical ways. First, the unit: some networks report at campaign level, some at audience segment level, and a few at store catchment level. Second, the window: attribution windows range from same-day to several weeks, and the choice changes the sales credited.
Third, the baseline: some networks compare exposed buyers with a matched control, others compare with the retailer's own prior period.
For an analyst, the first job is to write down those three choices per network before comparing anything. Comparing channels on common definitions is the discipline that keeps a grocery media plan from becoming a pile of incompatible numbers.
A table makes the reporting grain explicit. Source note and date: the entries below describe typical reporting shapes drawn from public network documentation and trade coverage reviewed in May 2026. They are not published rates, because each network publishes its own methodology and those documents change.
| Network | Loyalty or data asset | Typical reporting grain | What the advertiser receives |
|---|---|---|---|
| Tesco Media and Insight Platform | Clubcard | Campaign and audience segment | Reach, sales uplift, some new-to-brand measures |
| Nectar360 | Nectar | Campaign and segment | Nectar-linked sales, campaign reach |
| Boots Media Group | Advantage Card | Campaign | Sales and engagement in health and beauty |
| Asda Media | Asda Rewards | Campaign and store catchment | Sales uplift, catchment-level reporting |
| Morrisons Media | More card | Campaign | Sales and reach measures |
Read that table as a starting point for a measurement brief, not as a league table. The right question is which grain your decision needs, and whether the network can supply it without breaching its own data sharing limits.
Three questions on what retail media reporting does and does not support
The title promises three questions. Here they are, with the answers an analyst can act on.
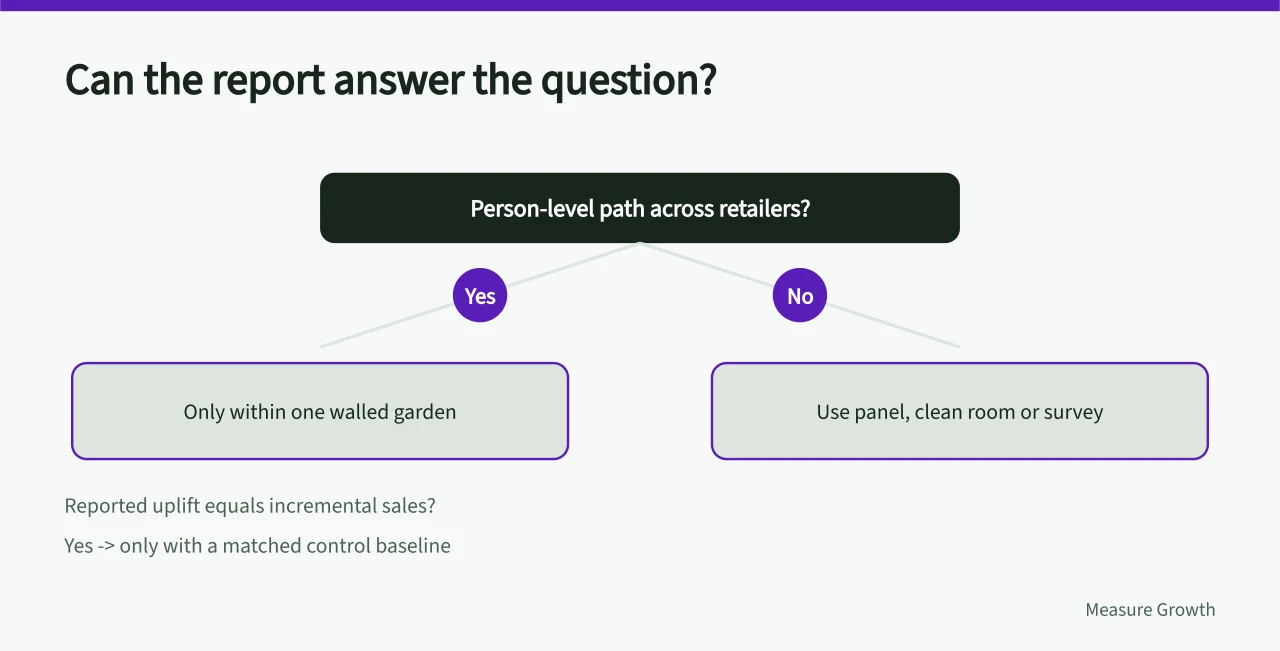
Question one: can the reporting support a person-level path across retailers?
No, not from the network reports alone. Each grocery network sees its own panel. A shopper who buys coffee at one retailer and biscuits at another appears in two separate walled gardens with no shared identifier. Retail media reporting limits bite hardest here: the reports support within-retailer attribution, not a cross-retailer path.
You can approximate a cross-retailer view with a panel, a clean room or a survey, but each of those adds assumptions. The network report itself does not carry the join key.
Question two: does reported uplift equal incremental sales?
Not automatically. Reported uplift is the difference between an exposed group and a comparison group, and its meaning depends on how the comparison group was built. If the baseline is the retailer's prior period, seasonality and promotion effects can sit inside the number.
If the baseline is a matched control, the estimate is stronger but still depends on match quality.
This is where attribution methods on one evidence grid help. Place each network's method on the grid by identification strategy, not by vendor name, and the weak comparisons become visible.
Question three: can the reporting support budget reallocation across networks?
Only after normalisation. Two networks can both report sales uplift and still measure different windows, different baselines and different populations. Reallocating budget on the raw numbers compares apples with a different fruit.
A worked example shows the problem. Network A reports a two-week window against a prior-period baseline and shows 8% sales uplift. Network B reports a four-week window against a matched control and shows 3% sales uplift. The figures are illustrative.
Normalise the window first: if A's rate held for four weeks, the raw figure would be around 16%. Normalise the baseline next: if the prior-period baseline includes 5 percentage points of seasonal lift, the comparable figure falls to around 11%.
Normalise the outcome last: if A reports total sales and B reports sales per exposed household, the two are still not comparable until both use the same denominator. After that step, the gap may close or widen, but the reallocation decision rests on the normalised number.
Where attribution methods have to change for grocery networks
Grocery retail media breaks several assumptions that digital attribution software inherits from search and display.
First, the identifier changes. In grocery, the durable identifier is a loyalty card or a payment-linked profile, not a cookie or a device. Attribution has to run at household level, with all the matching and consent questions that brings.
Second, the exposure changes. A grocery campaign may be seen in store, in an app, in a printed leaflet or on a retailer website. Impressions are not equivalent across those surfaces, and some exposures are not observable at all.
The Back to Basics Guide to Programmatic is a useful reference for how impression and click mechanics work in programmatic buying, but grocery adds offline surfaces that guide does not cover.
Third, the outcome changes. A grocery sale is a basket, not a single conversion. Attribution has to decide whether credit goes to the basket, the category or the brand line, and those choices change the answer.
Fourth, the baseline changes. Grocery demand is seasonal, promotion-driven and heavily affected by availability. A method that ignores stockouts will credit media for sales that would have happened anyway.
Where attribution methods change, in practice:
Where attribution methods have to change
- Move the unit of analysis from session to household or catchment.
- Replace last-click with a design that can estimate incrementality, such as a matched control or a geo holdout.
- Agree the definition layer with each network before the campaign starts.
- Keep a separate model for in-store exposure that cannot be observed at user level.
- Document the assumptions in the same place as the result, so the number travels with its caveats.
Attribution software on the advertiser side has a concrete job here. Clean room tools such as InfoSum let a brand match its own hashed CRM or sales records to a retailer's loyalty panel inside a secure environment.
The advertiser sees aggregated overlap, matched sales and modelled uplift, while row-level records stay in each party's tenancy. That is how a brand can enrich a network report without asking the network to hand over person-level data.
A geo holdout is often the cleanest option for grocery. You switch a region on and another off, then compare sales. The design is simple, but it needs enough store density and enough time to separate signal from noise. In the UK, the regional spread of grocery estates makes this feasible in some areas and thin in others.
When the design is right, the output is a decision rule, not a dashboard. Attribution metrics with complete cards, from event to decision rule, is the standard to aim for: every metric carries its source, its window, its baseline and the action it triggers.
Reading ONS retail sales statistics alongside network reporting
Retail industry - Office for National Statistics is the external frame for any UK grocery claim. The ONS Retail Sales Index publishes a food stores series and a total retail series, covering volumes and values on a monthly schedule.
The Office for Statistics Regulation oversees the code that governs how those statistics are produced, which matters when a vendor cites an ONS figure in a pitch. The figure has a definition, a period and a revision policy.
Use the ONS series for three jobs. First, as a seasonality frame: if network-reported sales rise in a month when the ONS food series also rises, part of the lift is market-wide. Second, as a sanity check on growth claims: a network claiming category growth far above the published retail trend needs a specific explanation.
Third, as a denominator for share estimates, with the caveat that ONS categories and retailer categories do not map one to one.
A concrete example. A brand sees reported grocery sales up over a period when the ONS food store series is broadly flat. The network number may still be real, but it is more likely to reflect share gain or a promotion than category growth. That distinction changes the follow-up action.
The ONS frame does not replace network reporting. It stops a network number from being read in isolation. The two together give a market view and a campaign view, and the gap between them is where the interesting questions sit.
Data sharing duties when a grocery network passes campaign data back
When a grocery network passes campaign data back to an advertiser, data protection law applies. The Data sharing | ICO guidance is the working reference for how to structure that exchange.
UK GDPR and the Data Protection Act 2018 set the core duties. PECR adds rules for electronic marketing and for storing or accessing information on a user's device. The ICO enforces these, and it has published guidance specific to data sharing, including the need for a lawful basis, a documented purpose and appropriate safeguards.
The practical duties for a retail media data share:
- Identify the lawful basis for the sharing, and record it.
- Define the purpose narrowly enough that the recipient cannot repurpose the data.
- Agree the fields, the grain and the retention period in writing.
- Decide whether the parties are controllers, joint controllers or processor and controller, and paper it accordingly.
- Apply the data minimisation principlepass aggregates or modelled outputs where row-level data is not needed.
- Document the transfer in a data sharing agreement, with a review date.
- Check whether a data protection impact assessment is required before the first transfer.
Two UK-specific points are easy to miss. First, the UK has its own adequacy and transfer regime, so an arrangement built for EU GDPR does not automatically fit. Second, the Digital Markets, Competition and Consumers Act 2024 gave the CMA new powers over digital markets.
The CMA's earlier Online platforms and digital advertising market study - GOV.UK set out the competition concerns about ad tech, measurement and attribution that still shape the debate.
Those concerns are not abstract. The CMA found that limited transparency and concentrated control over measurement can weaken advertisers' ability to verify performance. In grocery retail media, that translates into a practical question: how much of the measurement can the advertiser audit?
A workable answer is a layered data sharing agreement. The network keeps row-level data inside its environment. The advertiser receives aggregated campaign results, plus a specification of how those results were produced. If a clean room is used, the agreement should state who controls the matching and what leaves the room.
Attribution measurement built for England around five separate jobs is a useful frame here: collection, matching, modelling, validation and reporting are distinct jobs. Each has its own data sharing implications. Bundling them into one vendor contract is how duties get missed.
Finally, keep the audit trail. If a result is challenged, the agreement, the lawful basis and the method specification are the evidence. Without them, the number is just a claim.
Common questions
What is retail media attribution in a UK grocery network?
It is the process of linking a grocery campaign exposure to a sales outcome using the network's loyalty or transaction data. The network usually reports the result in aggregated or modelled form, so the advertiser sees campaign-level attribution rather than person-level paths.
Can I compare campaign results across Tesco, Nectar360 and other networks directly?
Not directly. Each network uses its own window, baseline and population. Normalise those three before comparing, or treat the comparison as directional only.
Do ONS retail sales statistics replace network reporting?
No. ONS statistics give a market-level frame for seasonality and trend. Network reporting gives a campaign-level view. Use both, and expect the categories not to map exactly.
What data can a grocery network legally pass back to an advertiser?
The ICO's data sharing guidance sets the test: lawful basis, defined purpose, minimisation and safeguards. In practice, many networks pass aggregated or modelled outputs rather than row-level data, and the agreement should say which.
Why does incrementality matter more than reported uplift in grocery?
Reported uplift depends on the comparison group. If the baseline is a prior period, seasonal and promotional effects can inflate it. An incrementality design, such as a matched control or geo holdout, estimates what would have happened without the campaign.
Where does attribution software fit if the network controls the data?
It fits on the advertiser side: normalising inputs, holding the assumption register and combining network outputs with the advertiser's own sales and ONS context. The software rarely replaces the network's measurement, and it should not pretend to.